


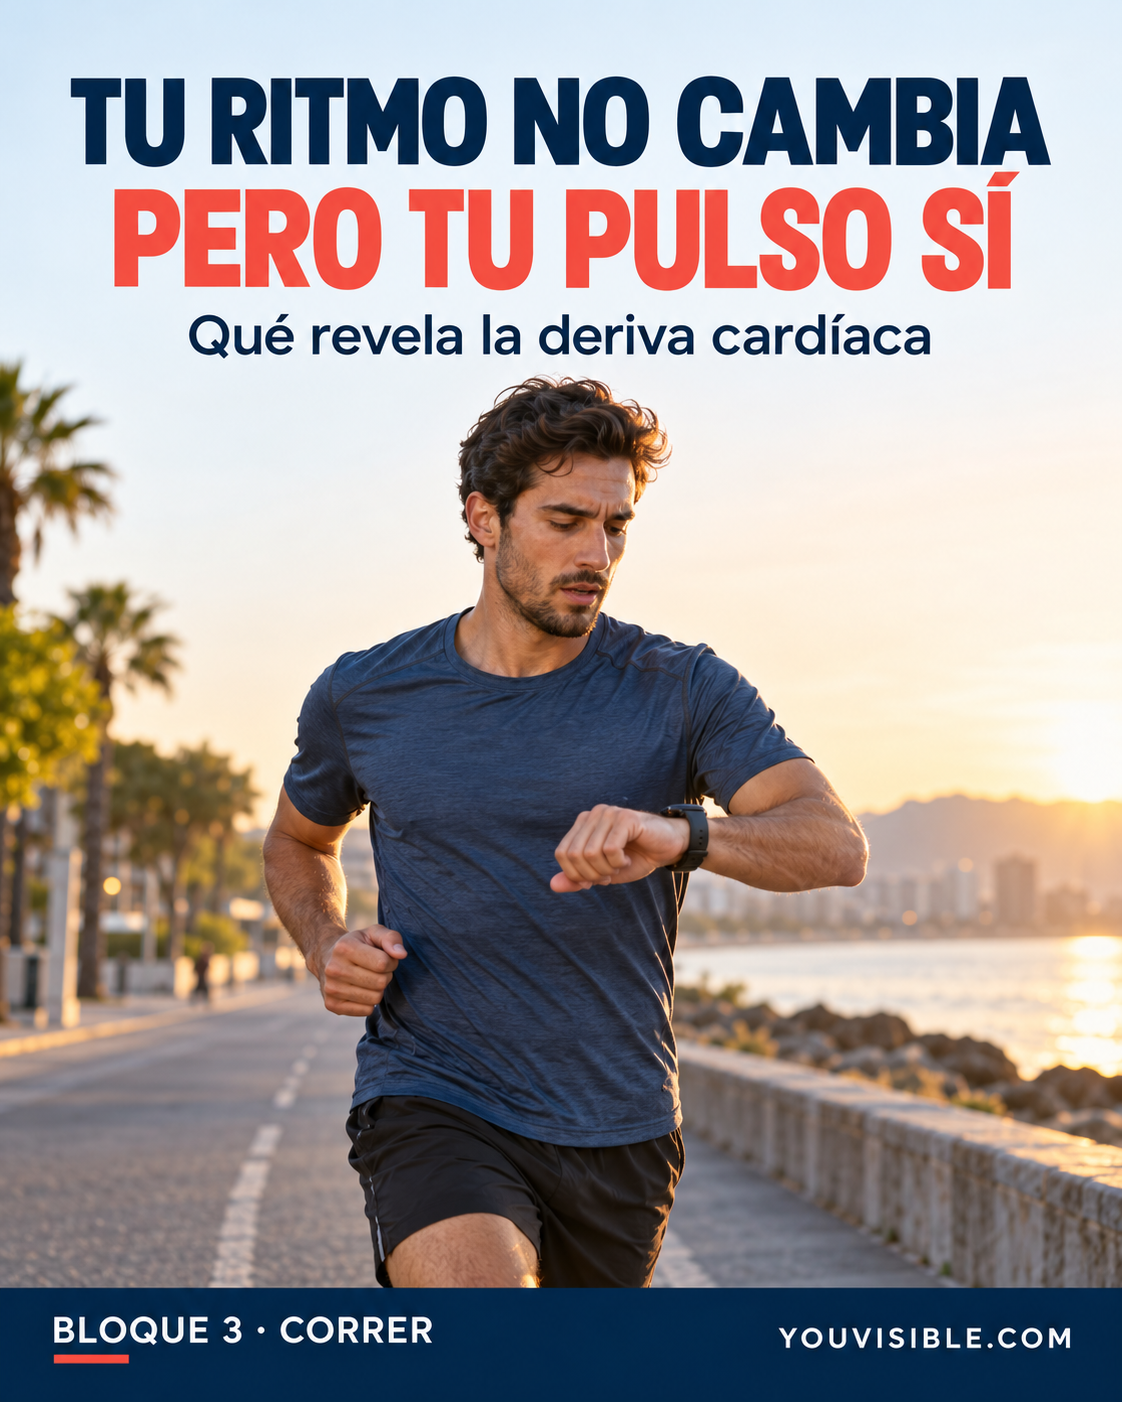
You head out at 6:00 min/km. The route stays fairly flat and your splits barely change, but your watch climbs from 142 to 151 beats per minute. Conversation starts to feel less comfortable. Have you lost fitness, or was the pace wrong from the start?
In BLOCK 3 · RUNNING, we look at how to interpret that growing gap between pace and pulse. The useful question is what changed during the run and how to respond. A single graph cannot tell the whole story, but it can help you make better training decisions.
Cardiovascular drift and decoupling are related concepts
Cardiovascular drift describes physiological adjustments during prolonged exercise: heart rate progressively increases and stroke volume, the amount of blood pumped with each heartbeat, commonly falls. Your watch records pulse; it does not directly measure stroke volume or establish the underlying mechanism.
Pace–heart rate decoupling is a practical observation: internal workload, represented here by heart rate, rises relative to a reasonably stable external workload, such as speed or power. It can also show up as declining speed while heart rate stays steady.
The concepts overlap, but they are not interchangeable. A decoupled graph may reflect cardiovascular drift, changing terrain, wind or measurement error. Research involving marathon runners examines the relationship between internal and external workload; that does not turn a watch into a clinical test.
What is happening inside your body?
Working muscles need blood while your body also needs to release heat. Over a long run, body temperature, circulation and heart rate regulation change. Sweating can reduce circulating fluid as losses accumulate. These processes interact rather than following an identical sequence in every runner.
When less blood leaves the heart with each beat, a higher heart rate can help maintain flow. A faster heart rate can itself shorten the filling time between beats. Reviews by Coyle and González-Alonso and Souissi and colleagues explain why a single mechanism is an incomplete explanation.
Drift does not automatically mean poor fitness. Well trained runners experience it too. Duration, weather and the relative intensity of that particular run matter. Holding your speed does not guarantee an unchanged physiological cost, particularly in hot conditions, as discussed by Wingo and colleagues.
What can make the gap larger?
Before judging your endurance, consider the circumstances:
- Heat and humidity: releasing heat becomes harder. Heavy sweating does not necessarily mean effective cooling when evaporation is limited.
- Duration: a pace that feels comfortable for twenty minutes may become demanding after an hour.
- Starting too fast: a sustainable pace for a short outing may be too ambitious for the planned block.
- Insufficient or poorly planned hydration: starting with a fluid deficit or accumulating losses can increase cardiovascular strain. Extra water does not address every cause.
- Fatigue and recovery: recent hard sessions, tired legs and inadequate rest can change your usual response.
- Energy availability: eating too little beforehand or starting with reduced fuel stores may affect exercise tolerance. Heart rate alone cannot identify an energy deficit.
- Caffeine, stress and poor sleep: these can influence your response; note departures from your usual routine.
- Developing illness: an unexpectedly hard effort combined with feeling unwell calls for caution, even before obvious symptoms appear.
- Altitude: compare runs at similar elevations and consider your level of acclimatisation.
- Watch measurement: an inaccurate reading can imitate a genuine rise.
The review of exercise under heat stress brings together temperature, hydration and performance. It does not justify chasing every extra heartbeat with water. Avoid forcing large quantities or trying to replace more fluid than you lose. Plan around the conditions, duration and your tolerance instead of suddenly drinking excessive volumes.
Check the reading before interpreting the trend
Drift usually looks like a gradual trend. A sudden jump, an unusually flat plateau or a value close to your step cadence suggests checking the optical sensor: movement can be mistaken for pulse. The shape of the graph provides a clue rather than proof of an error.
Check fit, placement, skin contact and cleanliness against the manufacturer's instructions. Cold conditions, arm movement and a loose strap can interfere with readings. When you need more precise comparisons, prefer a chest strap, fitted correctly with its electrodes prepared. Chest straps can also misread because of poor contact or a weak battery.
Compare the numbers with breathing and perceived effort. Suspicious data do not excuse ignoring symptoms, and feeling comfortable does not validate every reading. Repeat the observation with a reliable signal before drawing conclusions from small differences.
A repeatable observation protocol
Use an ordinary training session rather than turning this into a maximum effort:
- Choose a suitable day. Avoid testing when unwell or unusually fatigued. Find a flat route without crossings, or a treadmill where you can control the conditions.
- Warm up for 10–15 minutes, gradually settling into a comfortable effort.
- Run a continuous block of roughly 45–75 minutes, only if that duration suits your level and normal training. Use a shorter block if needed; do not extend a run simply to obtain a percentage.
- Keep the intensity conversational, with enough breath for complete sentences. Hold speed reasonably steady without accelerating to improve the result.
- Analyse only the steady block. Exclude the warm-up, cool-down, stops and hills. If this leaves disconnected fragments, choose another session rather than forcing a comparison.
- Split the block into equal time halves. Compare average speed and average heart rate alongside perceived effort. Use averages rather than a momentary peak.
- Repeat under comparable conditions: route, duration, time of day, temperature, food and device. Record differences you cannot control.
Remember that min/km and speed are inverse quantities. If a tool reports a decoupling percentage, check which relationship it calculates and which intervals it includes. Different formulas or analysis windows can produce different results from the same run, even when neither tool has made an arithmetic mistake.
Making sense of 142 to 151 bpm
Imagine a sixty minute block. The first thirty minutes average 6:00 min/km and 142 bpm; the second thirty average 6:01 min/km and 151 bpm. Speed barely changes while your heart beats around nine more times each minute. That is a meaningful separation to investigate in context.
Did the sun come out, the temperature rise or the wind turn against you? Was the opening pace comfortable? Could you still speak easily? Did the trace climb smoothly, or did the sensor suddenly jump? Those questions are more useful than marking the session as a pass or a failure.
The heart rate increase relative to 142 is about 6.3%, but that is not automatically the decoupling percentage from a speed-to-heart-rate calculation. The familiar 5% figure is a reference used in some training settings, not a universal medical or scientific boundary. This example prompts a review; it does not diagnose disease or independently measure your aerobic foundation.
What to change during and after the run
If the session was meant to be easy and conversation becomes difficult, ease your pace slightly. You do not need to defend the opening split. If the response is disproportionate to what is normal for you, shorten the session and reassess how you feel.
For the next outing, try a cooler time of day, review recovery and consider whether eating and drinking were appropriate. Change one relevant variable where practical. Changing the start time, duration, breakfast and pace together makes it harder to understand what helped. Repeat several comparable observations before deciding you need more aerobic training.
If an unusual response keeps recurring despite sensible adjustments to conditions and recovery, seek professional guidance. A better reading on another day does not retrospectively justify pushing through a session when you felt unwell.
Road, track, treadmill and trail
Road: repeated flat loops make comparison easier. An out-and-back route may hide a tailwind in one half and a headwind in the other. Record that difference rather than treating similar elevation as identical running conditions.
Track: measured distance and lap splits help control the workload, although heat, sun exposure and GPS error still matter. Use measured laps and stay in the same lane when practical.
Treadmill: keep speed, incline and ventilation consistent. A warming room or lack of a fan changes internal workload even when the display stays fixed. The displayed speed also depends on calibration; it is not an independent guarantee of accuracy.
Trail and mountain running: climbs, mud, technical footing and descents change the cost of covering a kilometre. Heart rate also lags behind changes in effort. Comparing halves by average pace is therefore less reliable. Look for consistent sections or interpret effort together with terrain. Estimated running power can add context, but does not remove these limitations.
When to stop
If you experience chest pain, dizziness, fainting, unusual palpitations or breathlessness out of proportion to the effort, stop exercising and seek professional assessment. Severe or persistent symptoms require urgent attention. Do not wait to calculate drift or assume that drinking water or slowing down is sufficient.
Finish with a short record
A useful observation fits into a brief note:
- Route, surface, elevation changes and duration of the analysed block.
- Average pace or speed and heart rate for each half, plus the device used.
- Temperature, approximate humidity, sunshine, wind and altitude.
- Perceived effort, ease of conversation and how you felt at the finish.
- Sleep, fatigue, food, fluid and relevant changes to your routine.
- Any adjustment made and what you will compare next time.
YouVisible lets you keep your activities and add context through notes or descriptions, as explained in our sports training diary guide. Recording route, duration, conditions, perceived effort and sensations helps reveal patterns; keep a supplementary record for any extra fields you need. You make the comparison yourself: this does not assume automatic drift calculations. The aim is to make a better decision for your next run without turning every easy session into an exam.
Scientific sources
- Souissi A et al. (2021). A new perspective on cardiovascular drift during prolonged exercise. Life Sciences.
- Coyle EF, González-Alonso J. (2001). Cardiovascular drift during prolonged exercise: new perspectives. Exercise and Sport Sciences Reviews.
- Wingo JE, Ganio MS, Cureton KJ. (2012). Cardiovascular drift during heat stress: implications for exercise prescription. Exercise and Sport Sciences Reviews.
- Périard JD, Eijsvogels TMH, Daanen HAM. (2021). Exercise under heat stress: thermoregulation, hydration, performance implications, and mitigation strategies. Physiological Reviews.
- Smyth B et al. (2022). Decoupling of Internal and External Workload During a Marathon: An Analysis of Durability in 82,303 Recreational Runners. Sports Medicine.